SysOrb product features
SysOrb server and network monitoring system comes with a lot of advanced functionalities which makes the system unique. Read about them below.
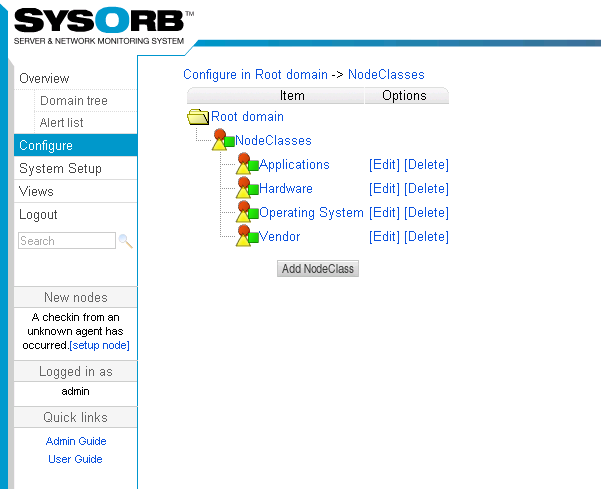
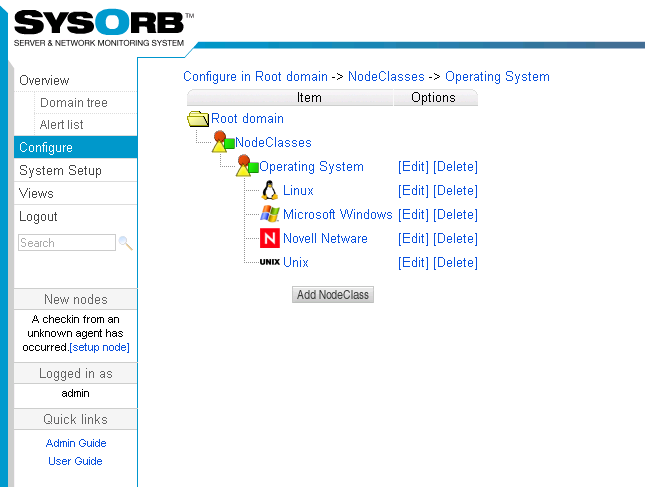
SysOrb provides policy-based configuration of nodes (NodeClasses)
An effective network monitoring software saves you time when it comes to configuration of checks on the different nodes in the network. The SysOrb NodeClass feature is an extremely powerful feature designed to save you time.
By configuring SysOrb nodeclasses you can make a policy that can be applied to multiple devices. You only have to configure a policy one time. For example you can make a policy NodeClass for your windows servers, exchange servers, SQL servers, switches and so on. Once a policy NodeClass is configured you can update or change them simultaneously on all the devices on a network that subscribe to those policies.
It is also possible to make specific overrides of a given NodeClass down to the final check level. With a large server farm you will find that the flexibility of NodeClasses comes in very handy over traditional template models.
Report Generator
The built-in report generator allows you to create reports based on the monitoring statistics collected by SysOrb NetChecks, AgentChecks and snmpChecks. The report editor lets you select any number and combination of domains, nodes and/or checks to include in the report.
There are different types of reports available e.g. on system availability, severe events and more.
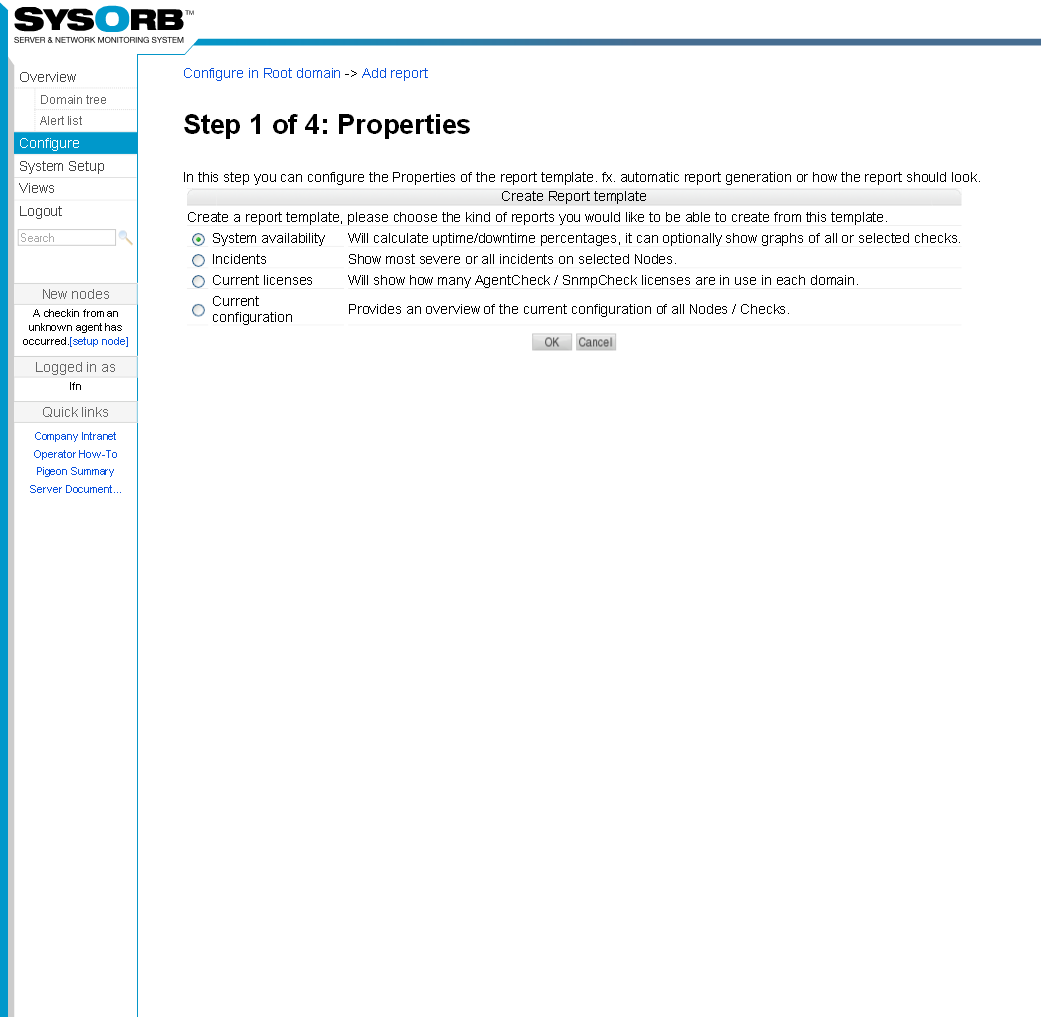
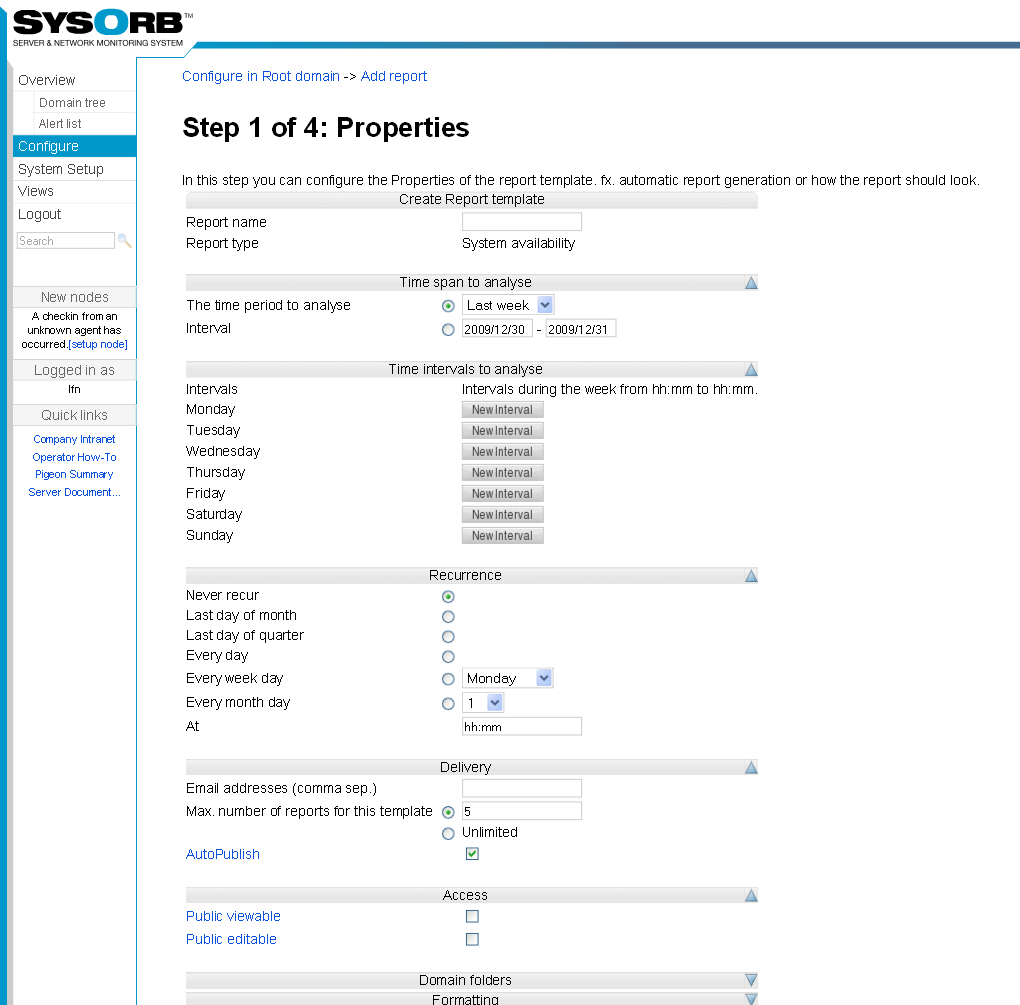
The report can be configured to be automatically generated and sent by e-mail at regular intervals – to internal or external receivers/customers. It will also be saved in for viewing in or printing from the SysOrb Web Interface.
Create, for instance, a report on disk space on all your servers to stay updated on your current need for disk space. Or do the same with your bandwidth usage and application response times and availability – the possibilities are numerous.
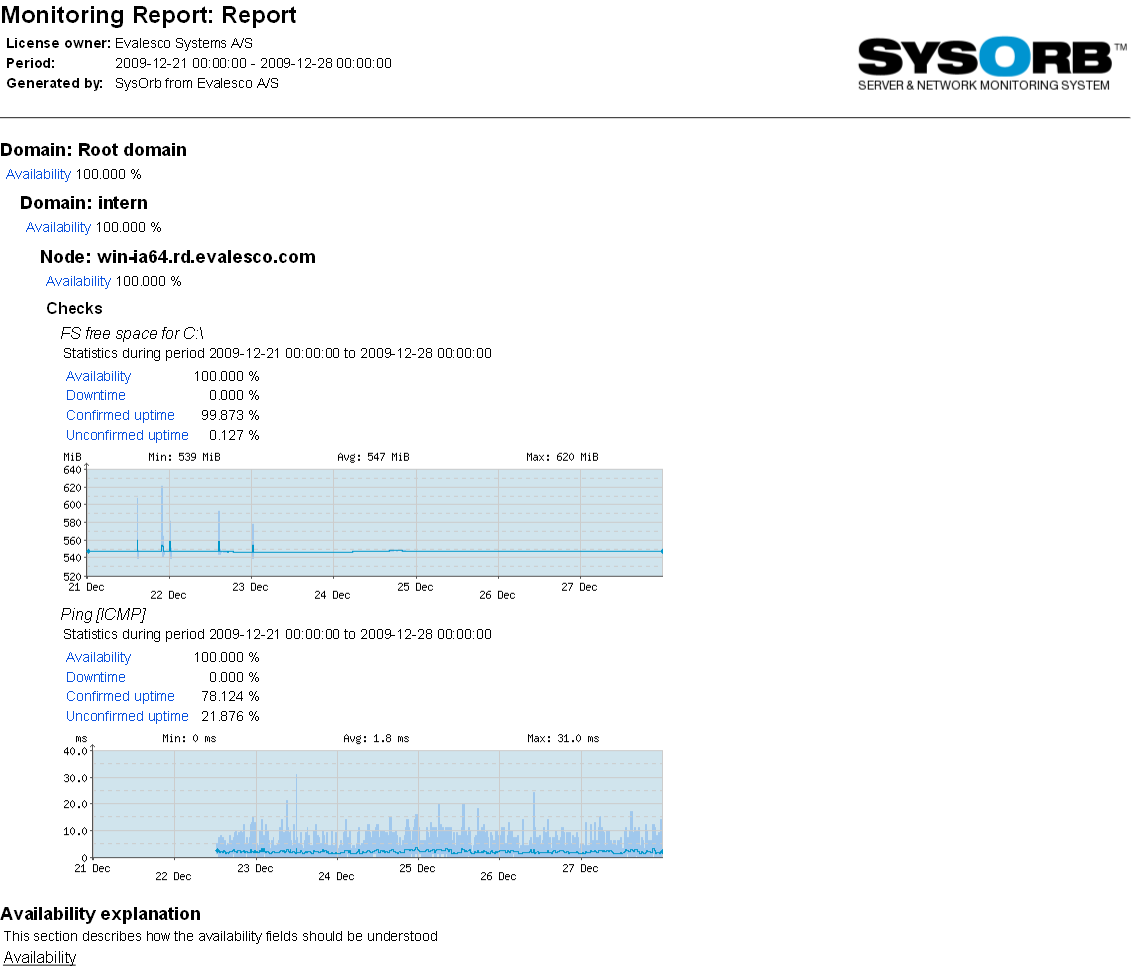
Reports can also be used to document service levels towards internal or external customers, detailing domain, node and check uptimes, service response times. Such a report will give you a detailed overview of the observed availability of any selection of nodes or checks.
Simply configure your warning and alert thresholds to correspond to the agreed service levels for any given service, and SysOrb will use those thresholds for alert generation and statistics calculation.
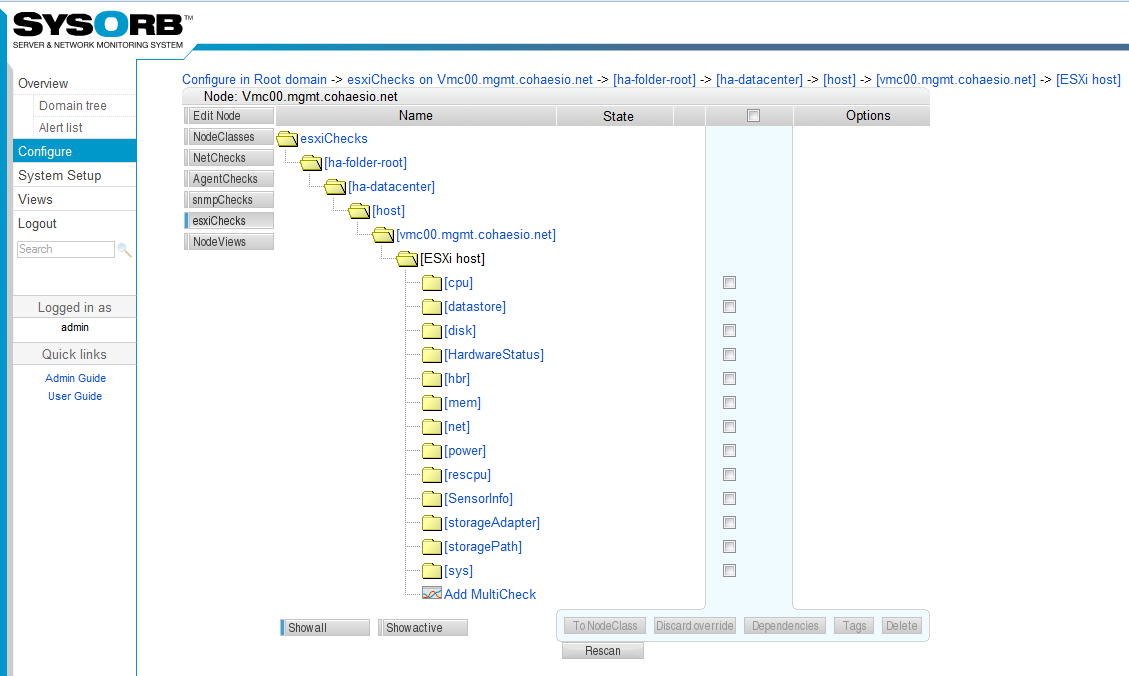
VMware ESXi host monitoring via vSphere Hypervisor API
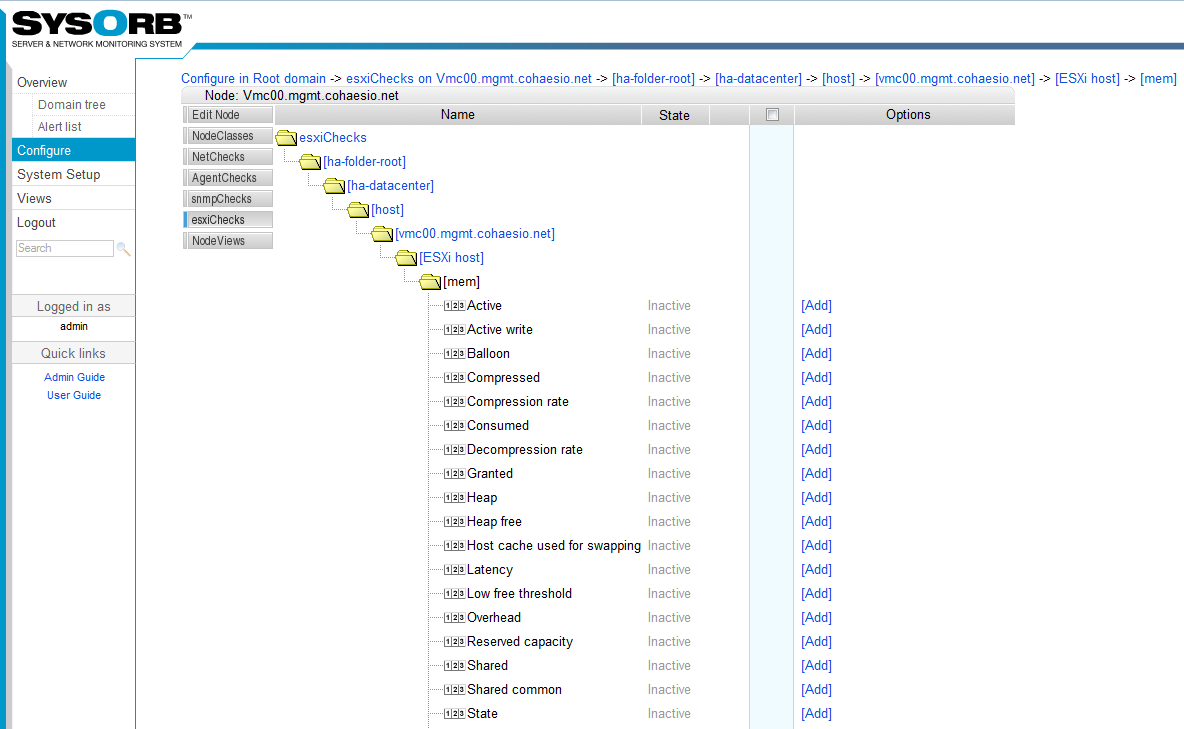
SysOrb supports monitoring of health and performance status of VMware ESXi hosts.
- Monitor the health and performance of the physical hardware where the host runs.
- Troubleshoot problems in the virtual environment before they happen.
- Easy setup and configure thresholds for alarms and have them sent via email, SMS or script.
- All data is instantly viewable in high resolution SysOrb graphs giving you a unique overview of your virtual environment.
SysOrb uses vSphere Hypervisor APIs to collect the critical metrics for the host as well as the individual VMs. Therefore no SysOrb agents are required in order to use this feature. However for deep monitoring of the OS and applications running on each single virtual instance it is still highly recommend to use SysOrb agents. See a video tutorial on how easy it is to start SysOrb VMware ESXi host monitoring here
SysOrb "map" feature
SysOrb "map" feature is a unique function that enables the user to easily upload a png image to the SysOrb server and network monitoring software. Typically the image would be a geographical map or a typology map of the network. Once a image has been uploaded, the user can chose to ad nodes, checks or domains to the image/map.
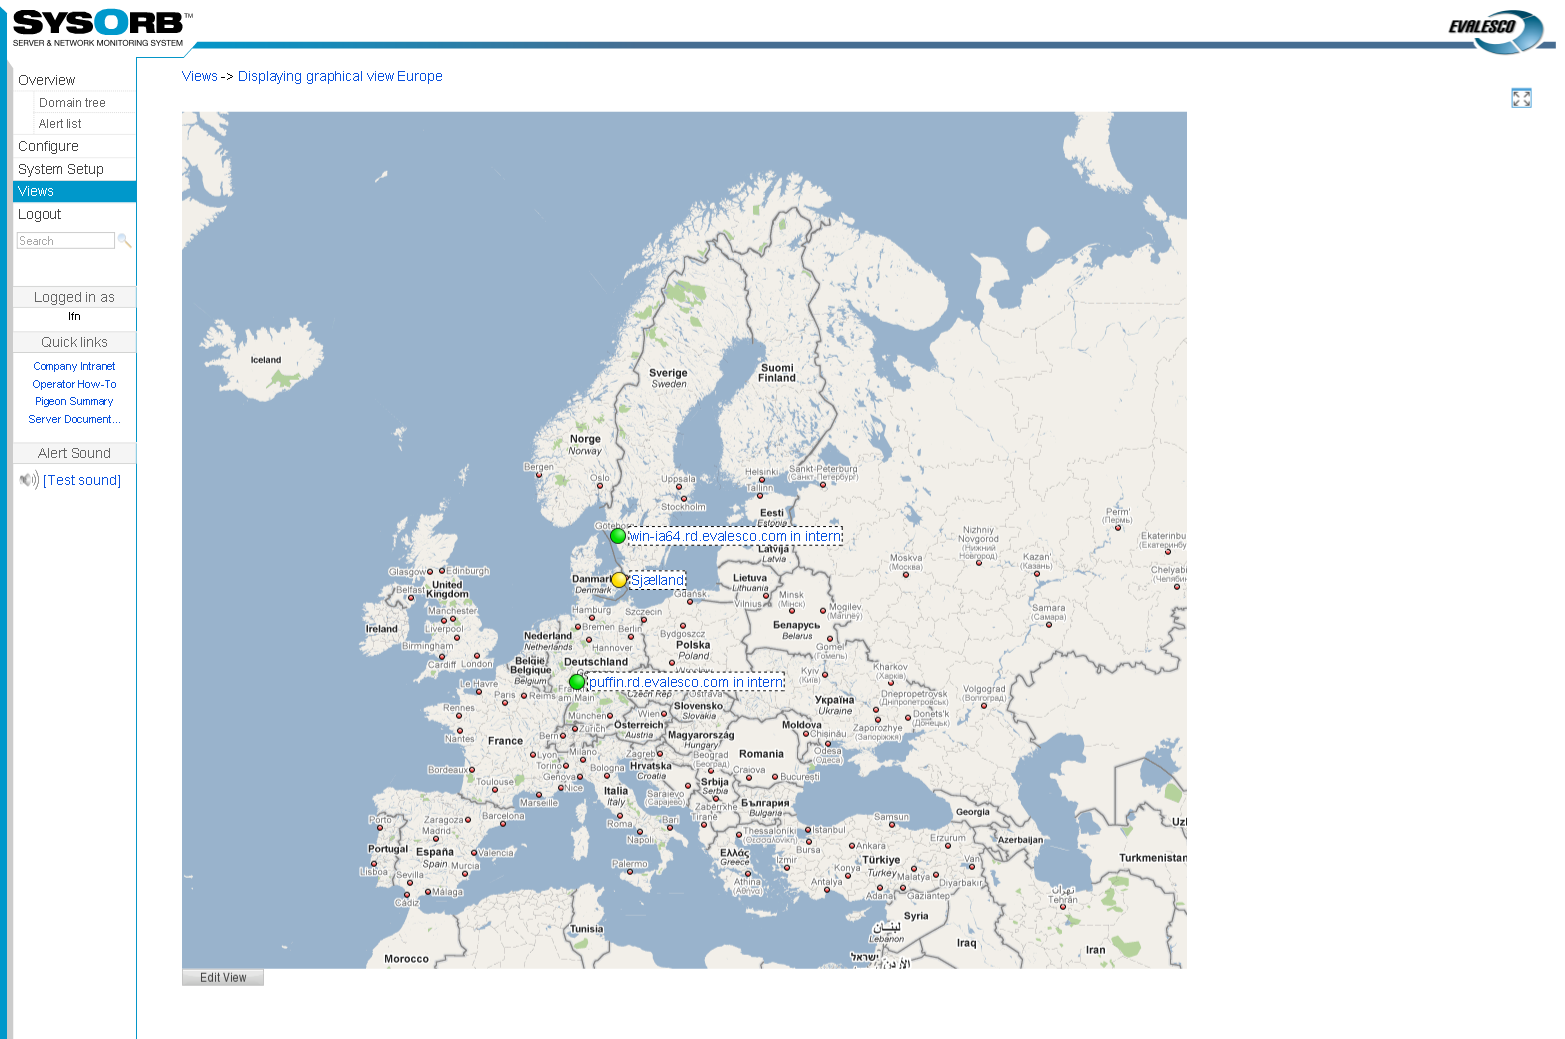
For example this feature can be used to:
- Create network maps with a status icon for each device on the map.
- Create "Map" views that can be shown on network operation center screens.
- Create a network overview for publishing on the company’s Intranet for e.g. information to the top management.
- Create a custom view of the most important nodes/checks in your network.
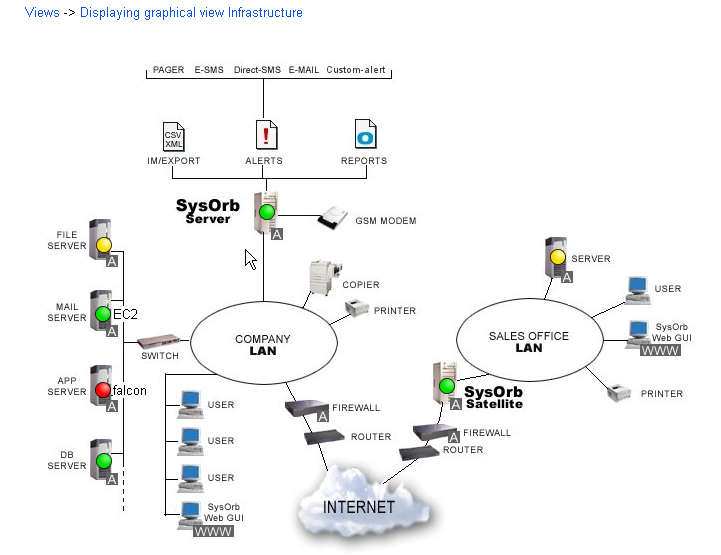
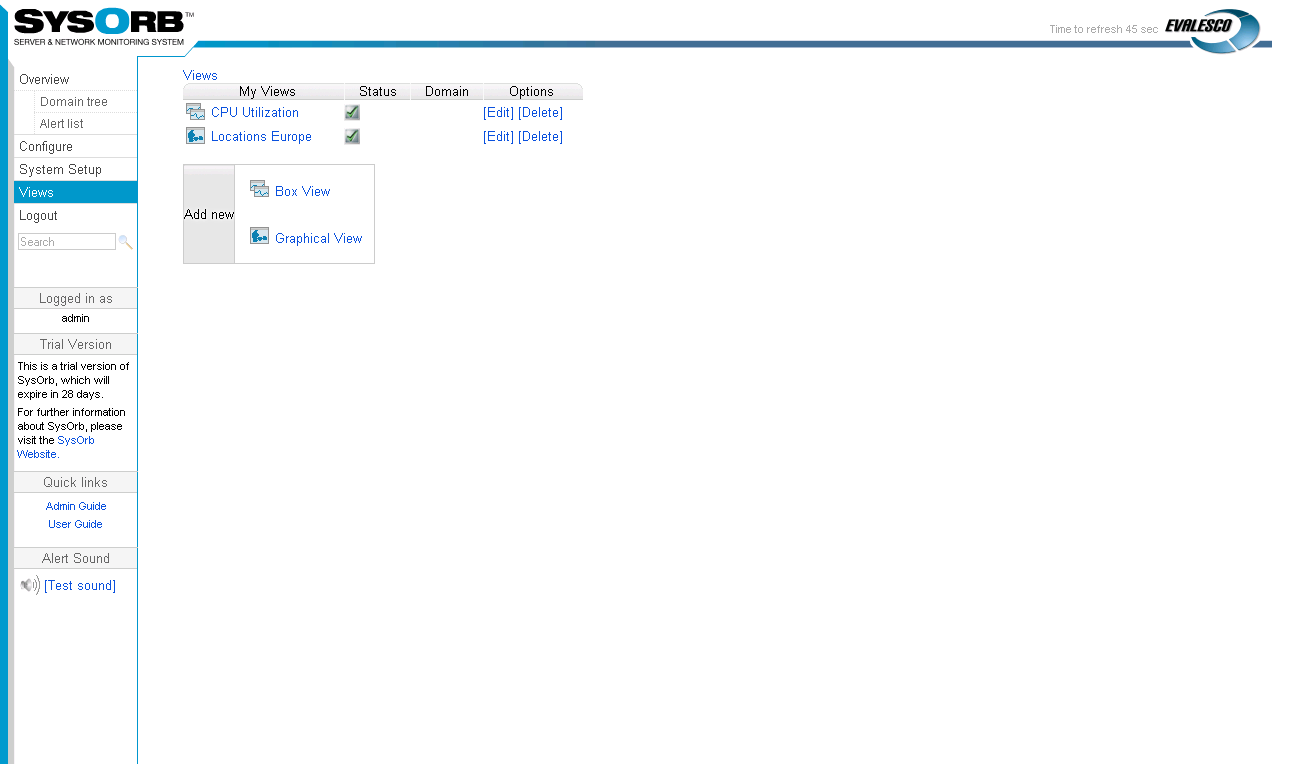
It is also possible to make so called view in view. This makes it easy for the user to navigate through a map e.g. navigating from one geographical view to another. Every view belongs to a domain. It may be the login domain of the creating user or a subdomain.
Create Business or Technical Views
Use the Views feature in SysOrb to customize personal or general views of domains, nodes or individual checks across the hierarchical structure of your network. These views can be either personal per user or shared among users.
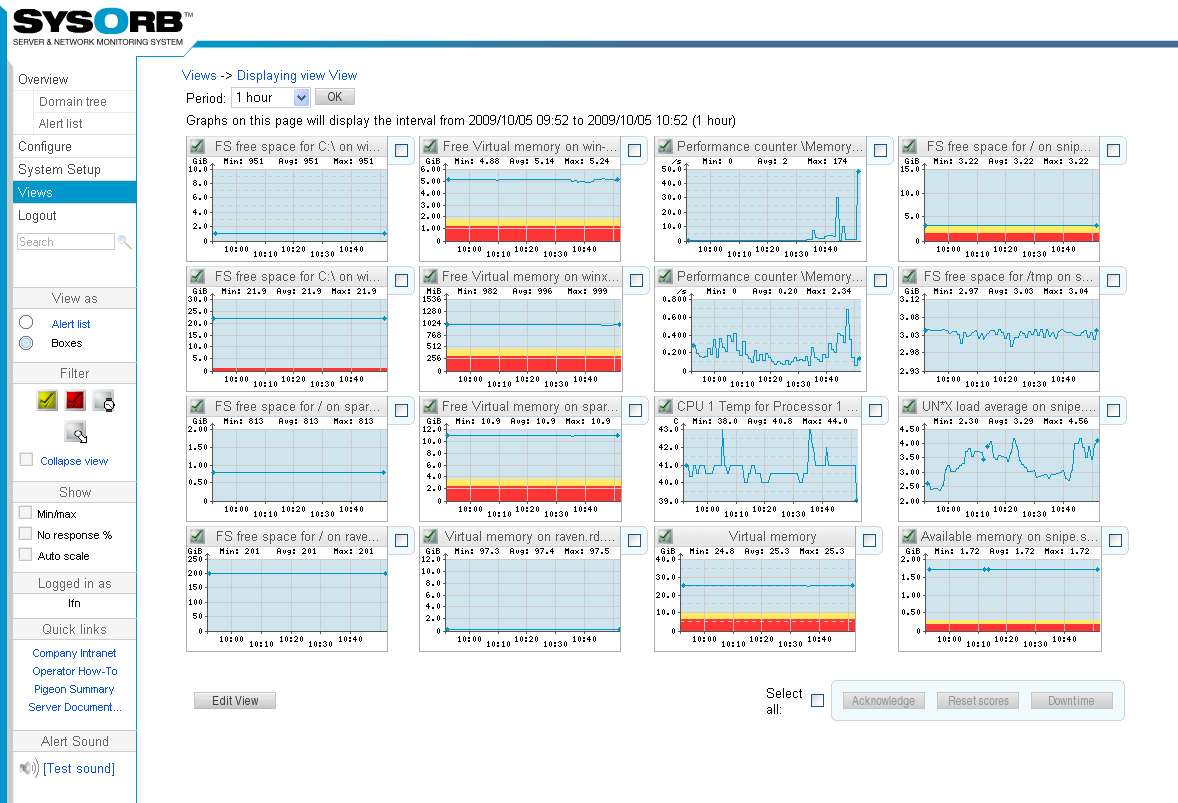
Such views will create easy ways of visually presenting the health status of services and applications specific to individuals or departments within your organization. But, they can also be used for specific purposes such as having one single view of e.g. disk space, memory or bandwidth usage on all servers/nodes across the entire network infrastructure. See live example her in our demo system View Example
Scheduled or Unexpected Downtime
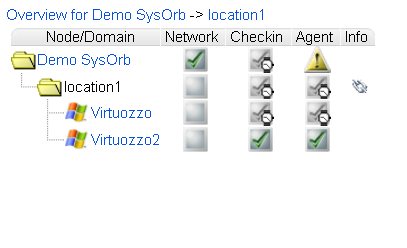
When a certain node or check has shifted status to warning or alert state, any administrator can set it into “downtime mode”. This mode will then be clearly indicated in the Web Interface with a separate icon. Use it to indicate to other administrators that the node or check state is being handled.
When an object in SysOrb is set to being in downtime, the users receiving notifications on the given object will receive a notification of the downtime status change.
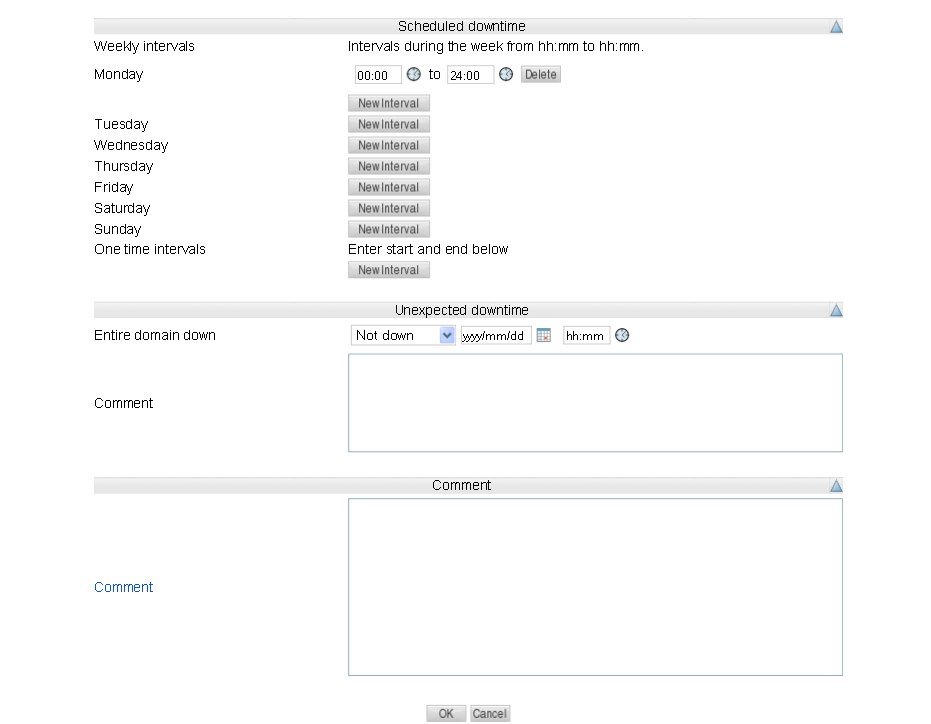
SysOrb will continue to monitor the object in the specified downtime interval, but it will not send out notification messages. That way, as little monitoring statistics as possible – if any – are lost, while avoiding an abundance of un-necessary notification messages.
This feature can also be used for e.g. nodes or applications that are only supposed to be operational in certain time intervals. Simply schedule the time intervals in SysOrb, and you will not get alert messages in those time intervals, even though SysOrb will continue the monitoring and statistics collection.
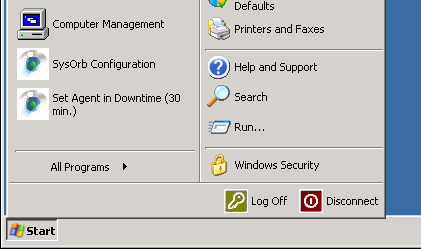
Set down time from agent.
This feature is easing the administration of the individual server. If an administrator or a consultant is doing work on a server, it is not necessary to have access to SysOrb web interface in order to set downtime on the agent. Unscheduled downtime can be set from the agent itself out on the server. The feature is also very useful when rolling out software updates to a server in order to avoid false alarms.
Restricted User Access
Give your customers/users full or restricted access to view and/or edit their own nodes in SysOrb.
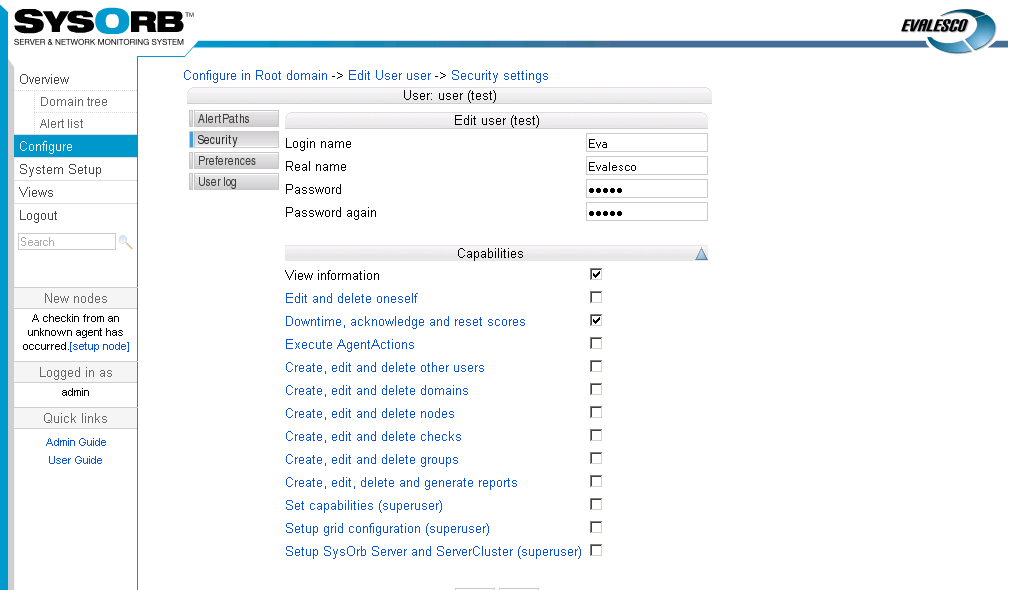
SysOrb allows you to divide your monitored nodes into so-called SysOrb Domains, which can be different geographical locations and/or different customers (within a hosting center or at customer locations), or different types of nodes within a WAN/LAN. It is then possible to create users within the SysOrb Domains that can only access the nodes in those Domains, thereby allowing for multi-tier customer management in one SysOrb installation.
This option is especially usefull for service providers who would like to offer SysOrb as a hosted monitoring service to their customers.
Monitor anything with custom agent checks
If the built-in checks of the SysOrb Agent does not suffice for you particular setup, you may write monitoring extension scripts that can perform the check. The custom checks that an SysOrb Agent is able to execute is configured using a file on the machine running the SysOrb Agent.In that way you can actually monitor everything you want and get it visualized as a graph in the SysOrb monitoring system. It could be application-specific metrics like e.g. the number sales per day or some specific database metric that you would like to monitor. You can write these scripts in any language you desire. The only requirement is that the script must deliver the result of the check to the SysOrb Agent. It is very easy and flexible to work with custom agent check in SysOrb and the feature is widely used by e.g. database administrators. Read more about how to configure custom checks in the manual section 8.3 or see a Get started tutorial where it is showed how to set up a custom agent check in SysOrb. You also find a collection of some of some useful example scripts which can be used here.
Ease the administrations of your server via SysOrb Agent actions
Agent Actions is a feature that can help ease remote administration of your servers. A user is able via the SysOrb web interface to execute a action which is carried out by the agent on the server where the SysOrb agent runs. As an example you can use agent action to give non-administrators/helpdesk personal/customers a secure and easy way to solve task which under normal circumstances would require admin logon to the server. As an admin you can give non-administrators/helpdesk personal/customers access to only view information’s in the monitoring system and the also access to carry out actions. An Agent Action could e.g. restart IIS service, or reboot the target machine.

As with custom agent checks the SysOrb agent read the actions from a configuration file which is specified on the machine where the agent runs. This also means that you basically can create all kind of actions via a script. Of cause you can also use agent action from your Smartphone so that you can use it when you are out in the field. As with everything else in SysOrb it is easy and flexible to work with agent actions in SysOrb. See a Get started tutorial where it is showed how to set up a Agent action in SysOrb.
Configuration of automated actions – Remedy
From SysOrb 4.0 it is possible for SysOrb to automatically carry out an already configured agent action.A typical situation where remedy is used could be to automatically restart a web server if it stops responding correctly. This feature will improve possible downtime in many situations and automate many of the IT administrators task. Basically, once a predefined threshold is reached on a check,Sysorb can automatically execute any script from the agent. This makes this feature very flexible.
Advanced hardware monitoring via the SysOrb agent
The SysOrb agent supports monitoring of hardware parameters on the server such as the server chassis LED, fan speeds, temperatures, voltages, etc. by means of IPMIl (Intelligent Platform Management Interface) which is an open standard that is integrated into most systems by hardware manufacturers.
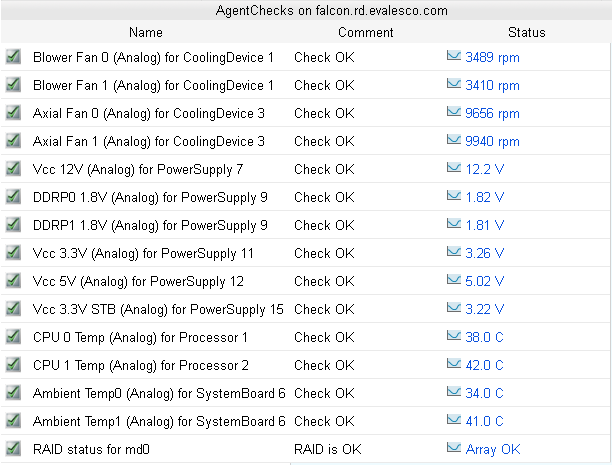
This mean that if you use the SysOrb monitoring solution then once should not need to run e.g. HP Insight Management Agents or IBM Director Agent in order to have hardware monitoring on the servers. Our philosophy is that you should be able to monitor everything you need on the server with only the SysOrb agent installed. Check out some hardware checks on this server here in our demo.
RESTful API for SysOrb
A RESTful API is shipped with SysOrb server. The API makes it easy to integrate SysOrb with third party software applications and give developers the option to use SysOrb data in other applications. The new API is available for both Windows and Linux platform. Documentation on how to use the API is available in the SysOrb administrator manual.Service Providers could e.g. use the API to integrate monitoring service into a customer portal.
Below is an example provided this is a live graph from:demo.sysorb.com which has been integrated into our website.
